


Prometheus 安装与部署
Prometheus 安装与部署
下载安装包
wget https://github.com/prometheus/prometheus/releases/download/v2.30.3/prometheus-2.30.3.linux-amd64.tar.gz
解压安装包
tar -xf prometheus-2.30.3.linux-amd64.tar.gz
进入目录
cd prometheus-2.30.3.linux-amd64/
启动
./prometheus
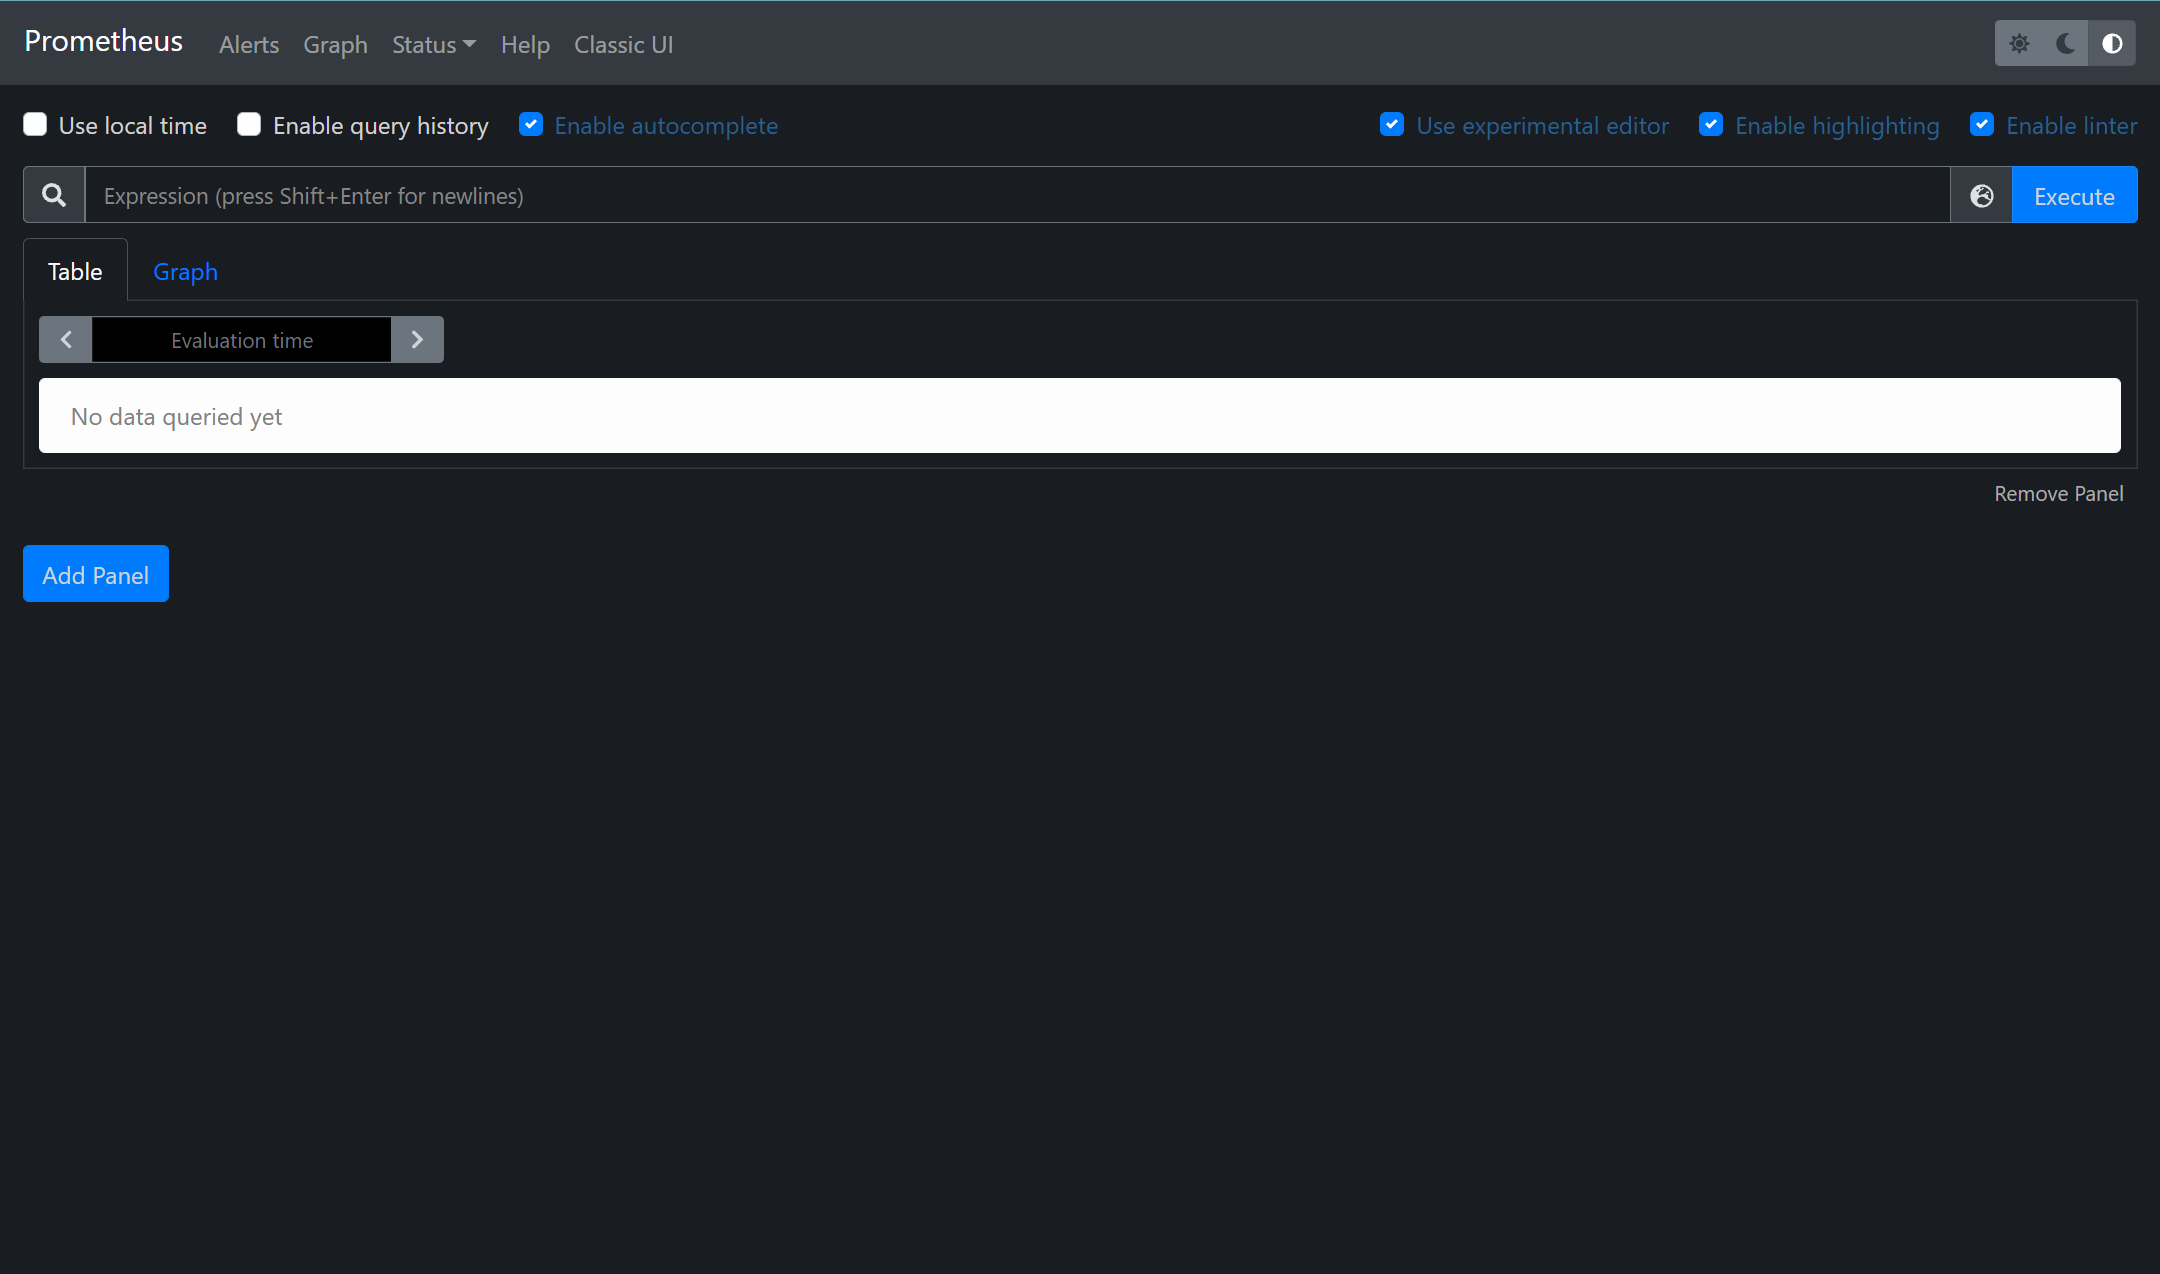
检查启动
访问 https://10.0.0.66:9090
下载node exporter
wget https://github.com/prometheus/node_exporter/releases/download/v1.2.2/node_exporter-1.2.2.linux-amd64.tar.gz
解压安装包
tar xf node_exporter-1.2.2.linux-amd64.tar.gz
拷贝创建至命令
cd node_exporter-1.2.2.linux-amd64			[[进入目录检查启动命令]]
cp node_exporter /usr/local/bin/			[[cp到/usr/local/bin/]]
启动
node_exporter
从Node Exporter收集监控数据
修改Prometheus配置文件
编辑prometheus.yml并在scrape_configs节点
cd prometheus-2.30.3.linux-amd64			[[cd到prometheus目录]]
vim prometheus.yml							[[编辑prometheus]].yml

在scrape_configs节点添加以下内容

  # 采集node exporter监控数据
  - job_name: 'server-data'
    static_configs:
      - targets: ['localhost:9100']
重新启动Prometheus Server
cd prometheus-2.30.3.linux-amd64
./prometheus
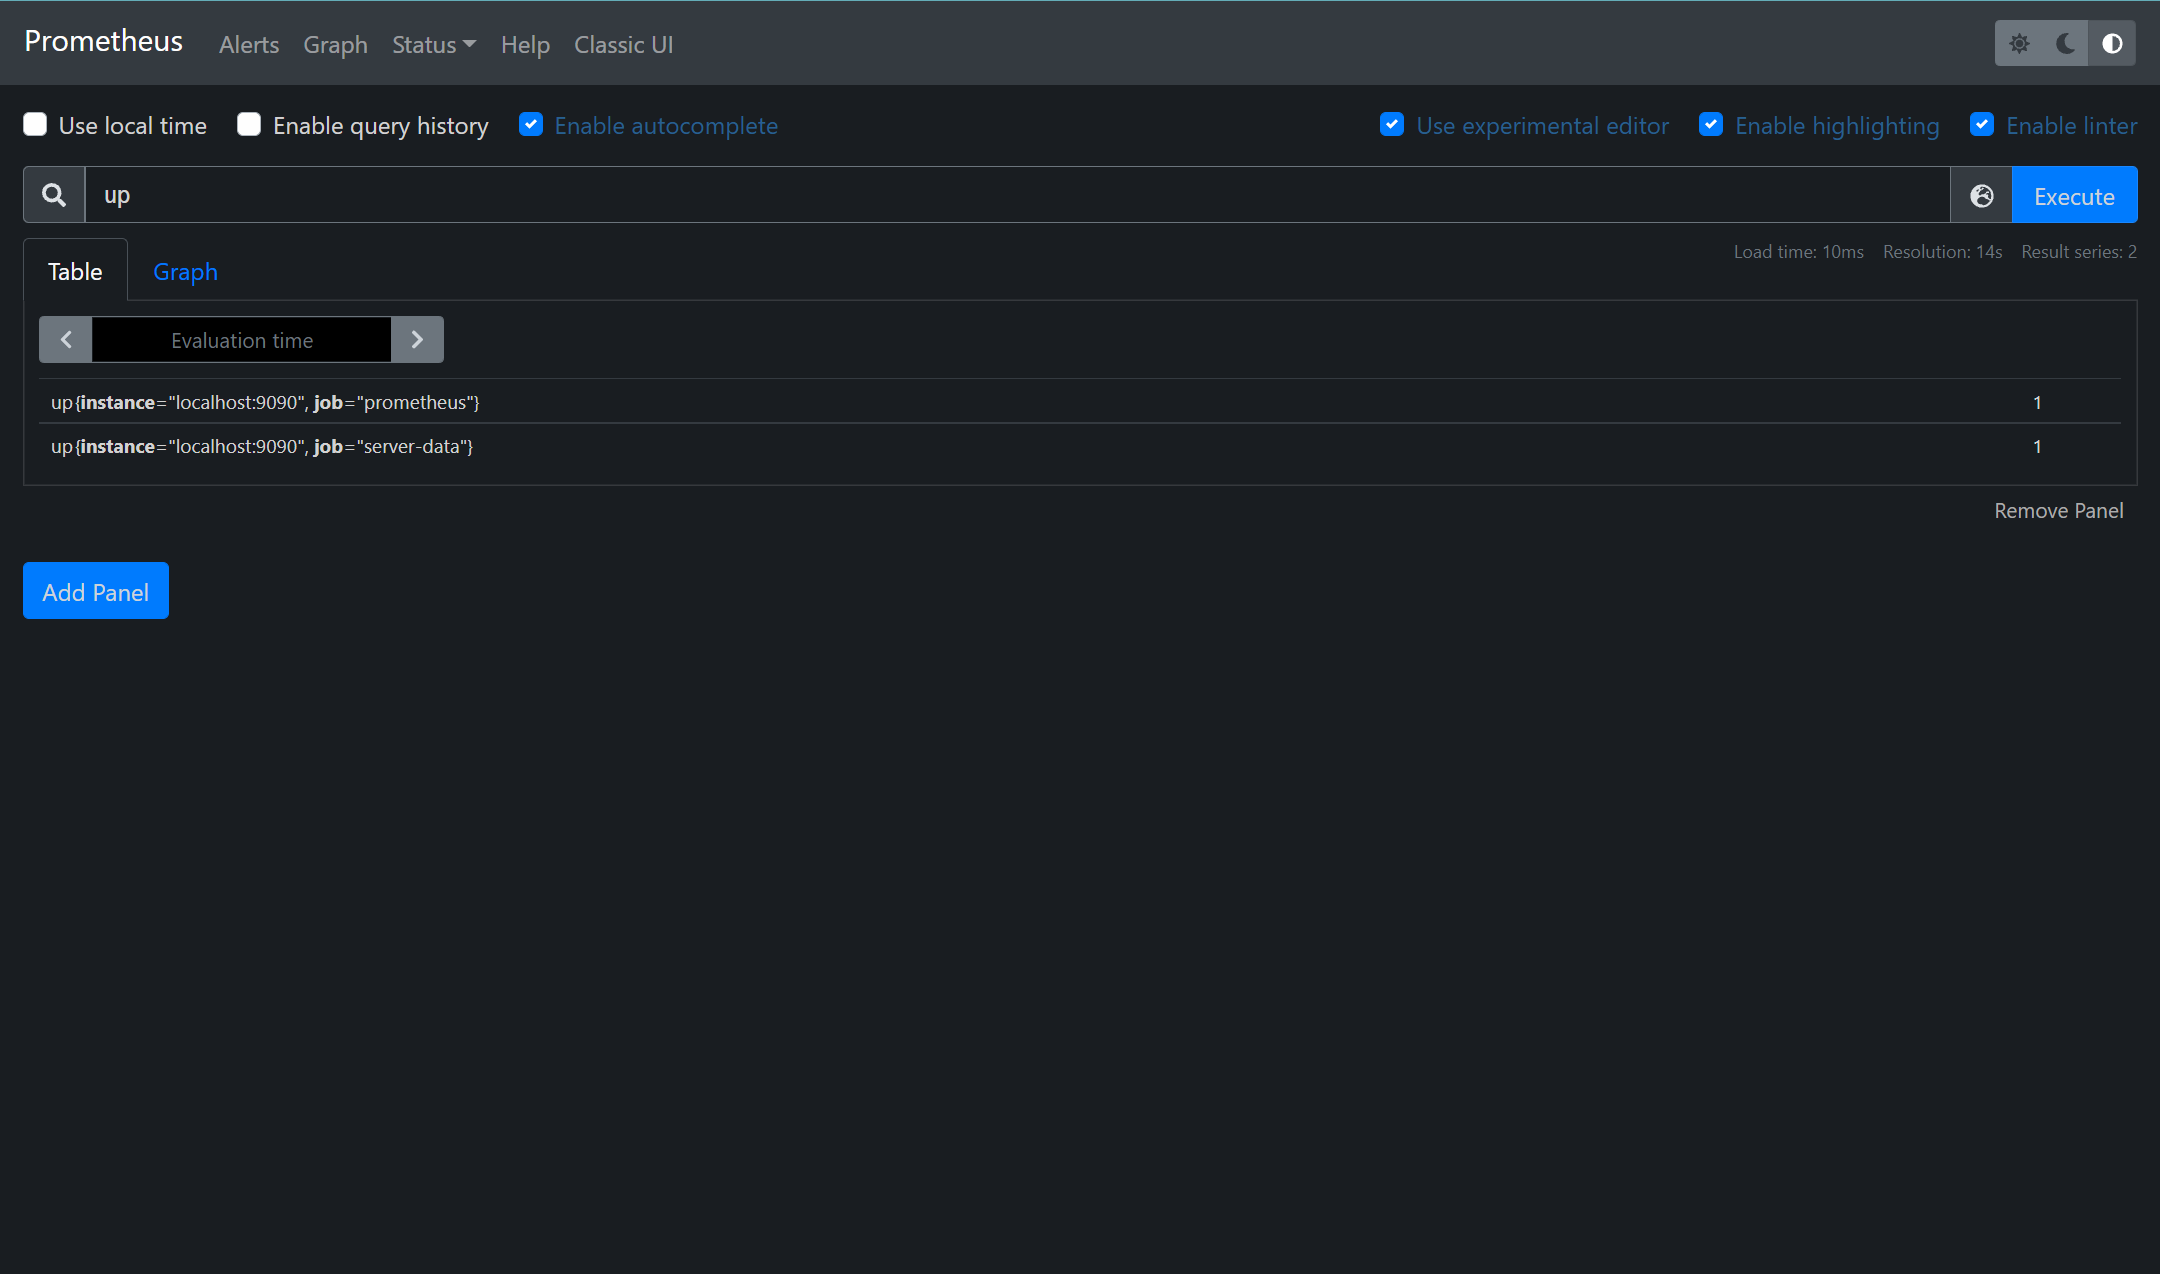
访问web
在搜索栏搜索up显示如下即为能够正常获取数据
其中1表示正常,反之0则为异常
使用Grafana创建可视化Dashboard
获取Grafana
wget https://dl.grafana.com/enterprise/release/grafana-enterprise-8.2.1-1.x86_64.rpm
安装
yum install grafana-enterprise-8.2.1-1.x86_64.rpm
启动&自启
systemctl enable grafana-server
ystemctl start  grafana-server
访问IP地址的3000端口
输入初始用户和密码皆为:admin
第一次登录需修改密码

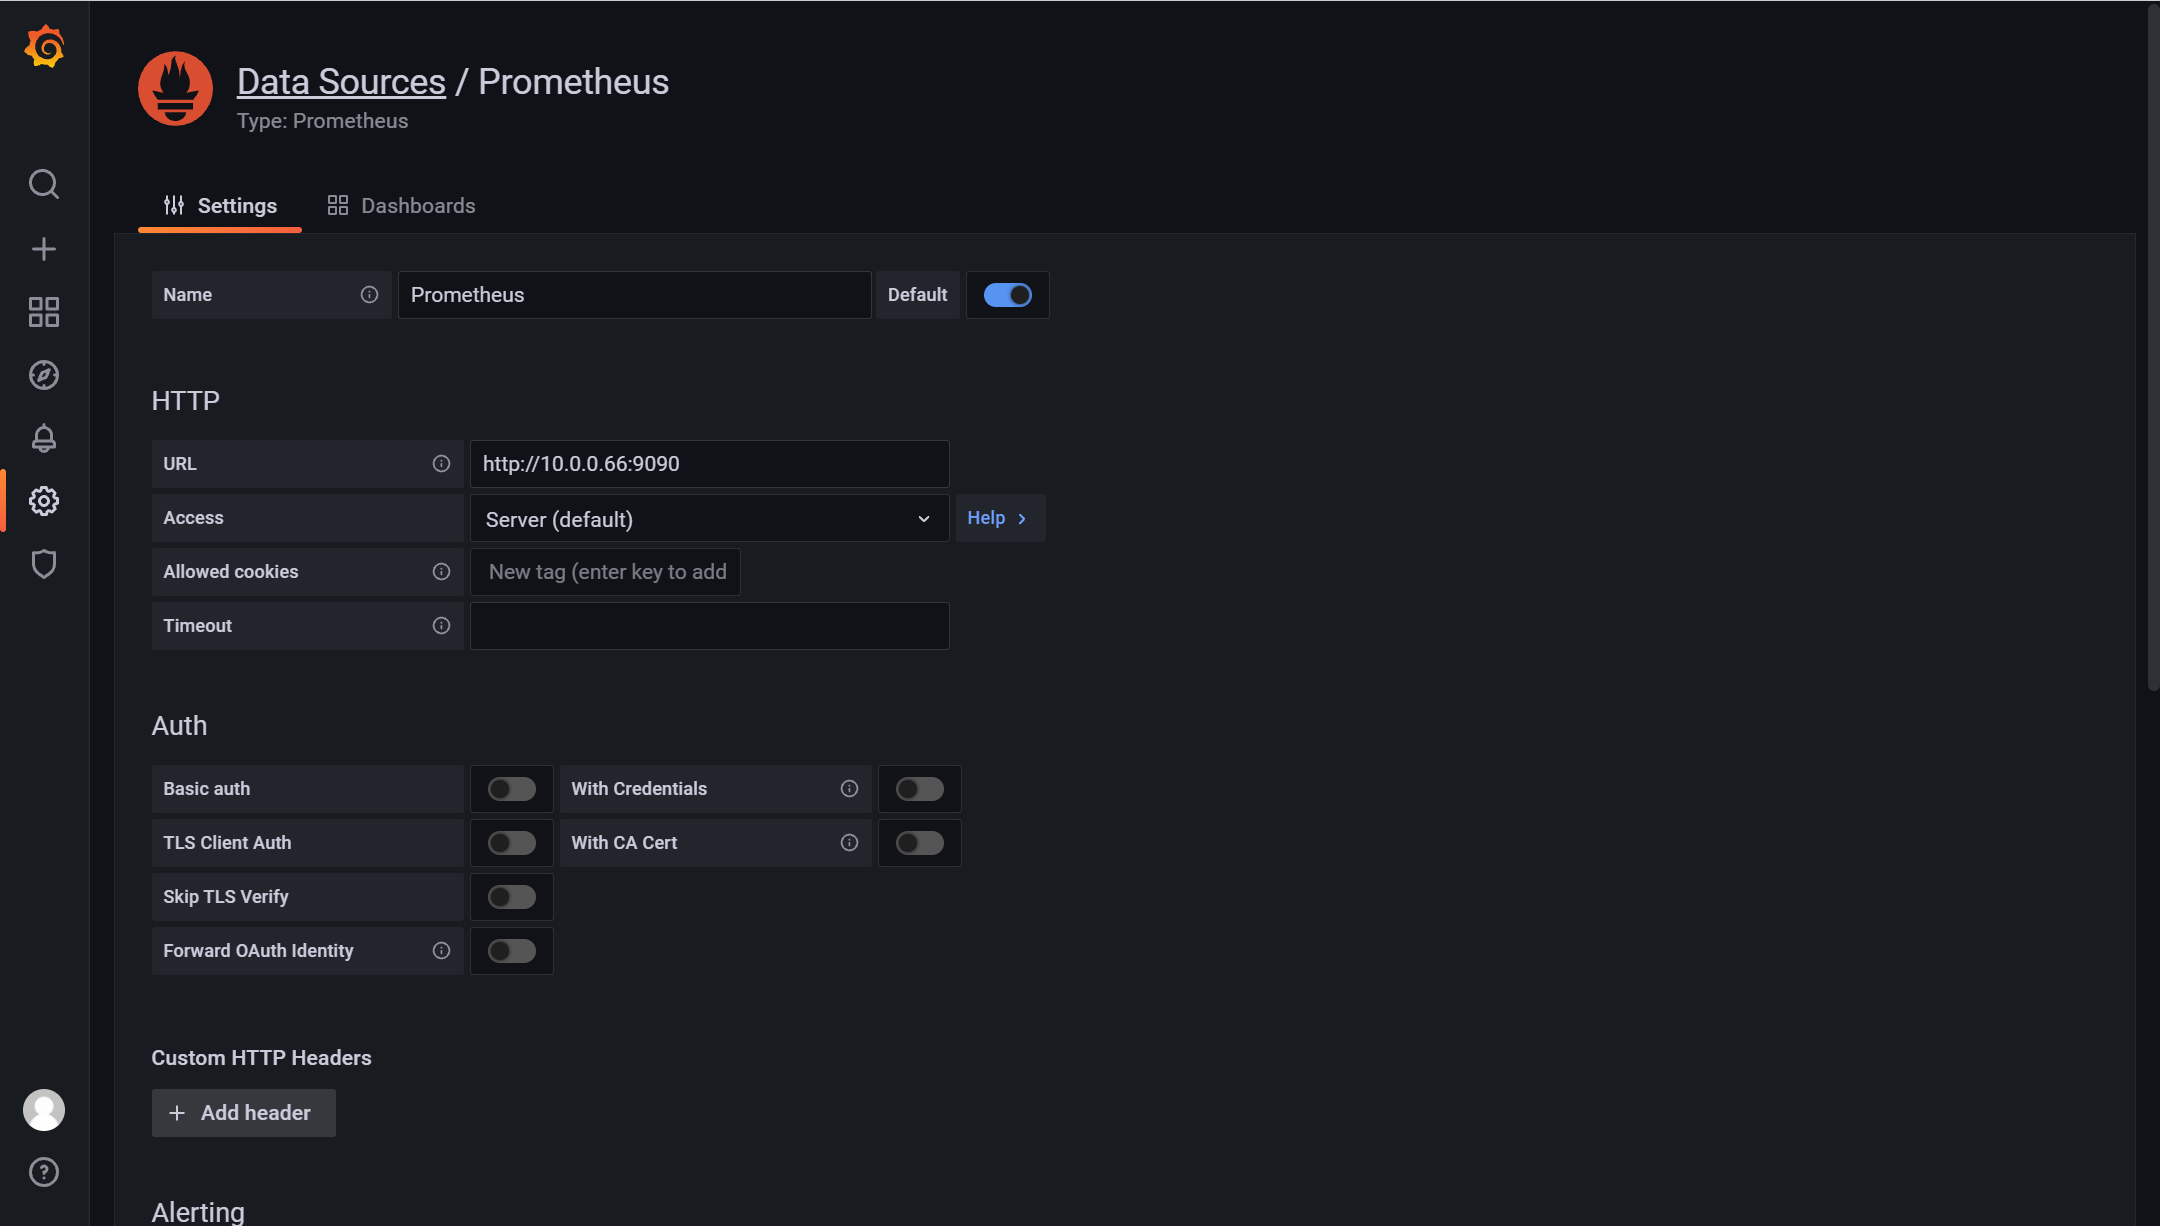
导入prometheus数据源

URL填入IP端口后保存
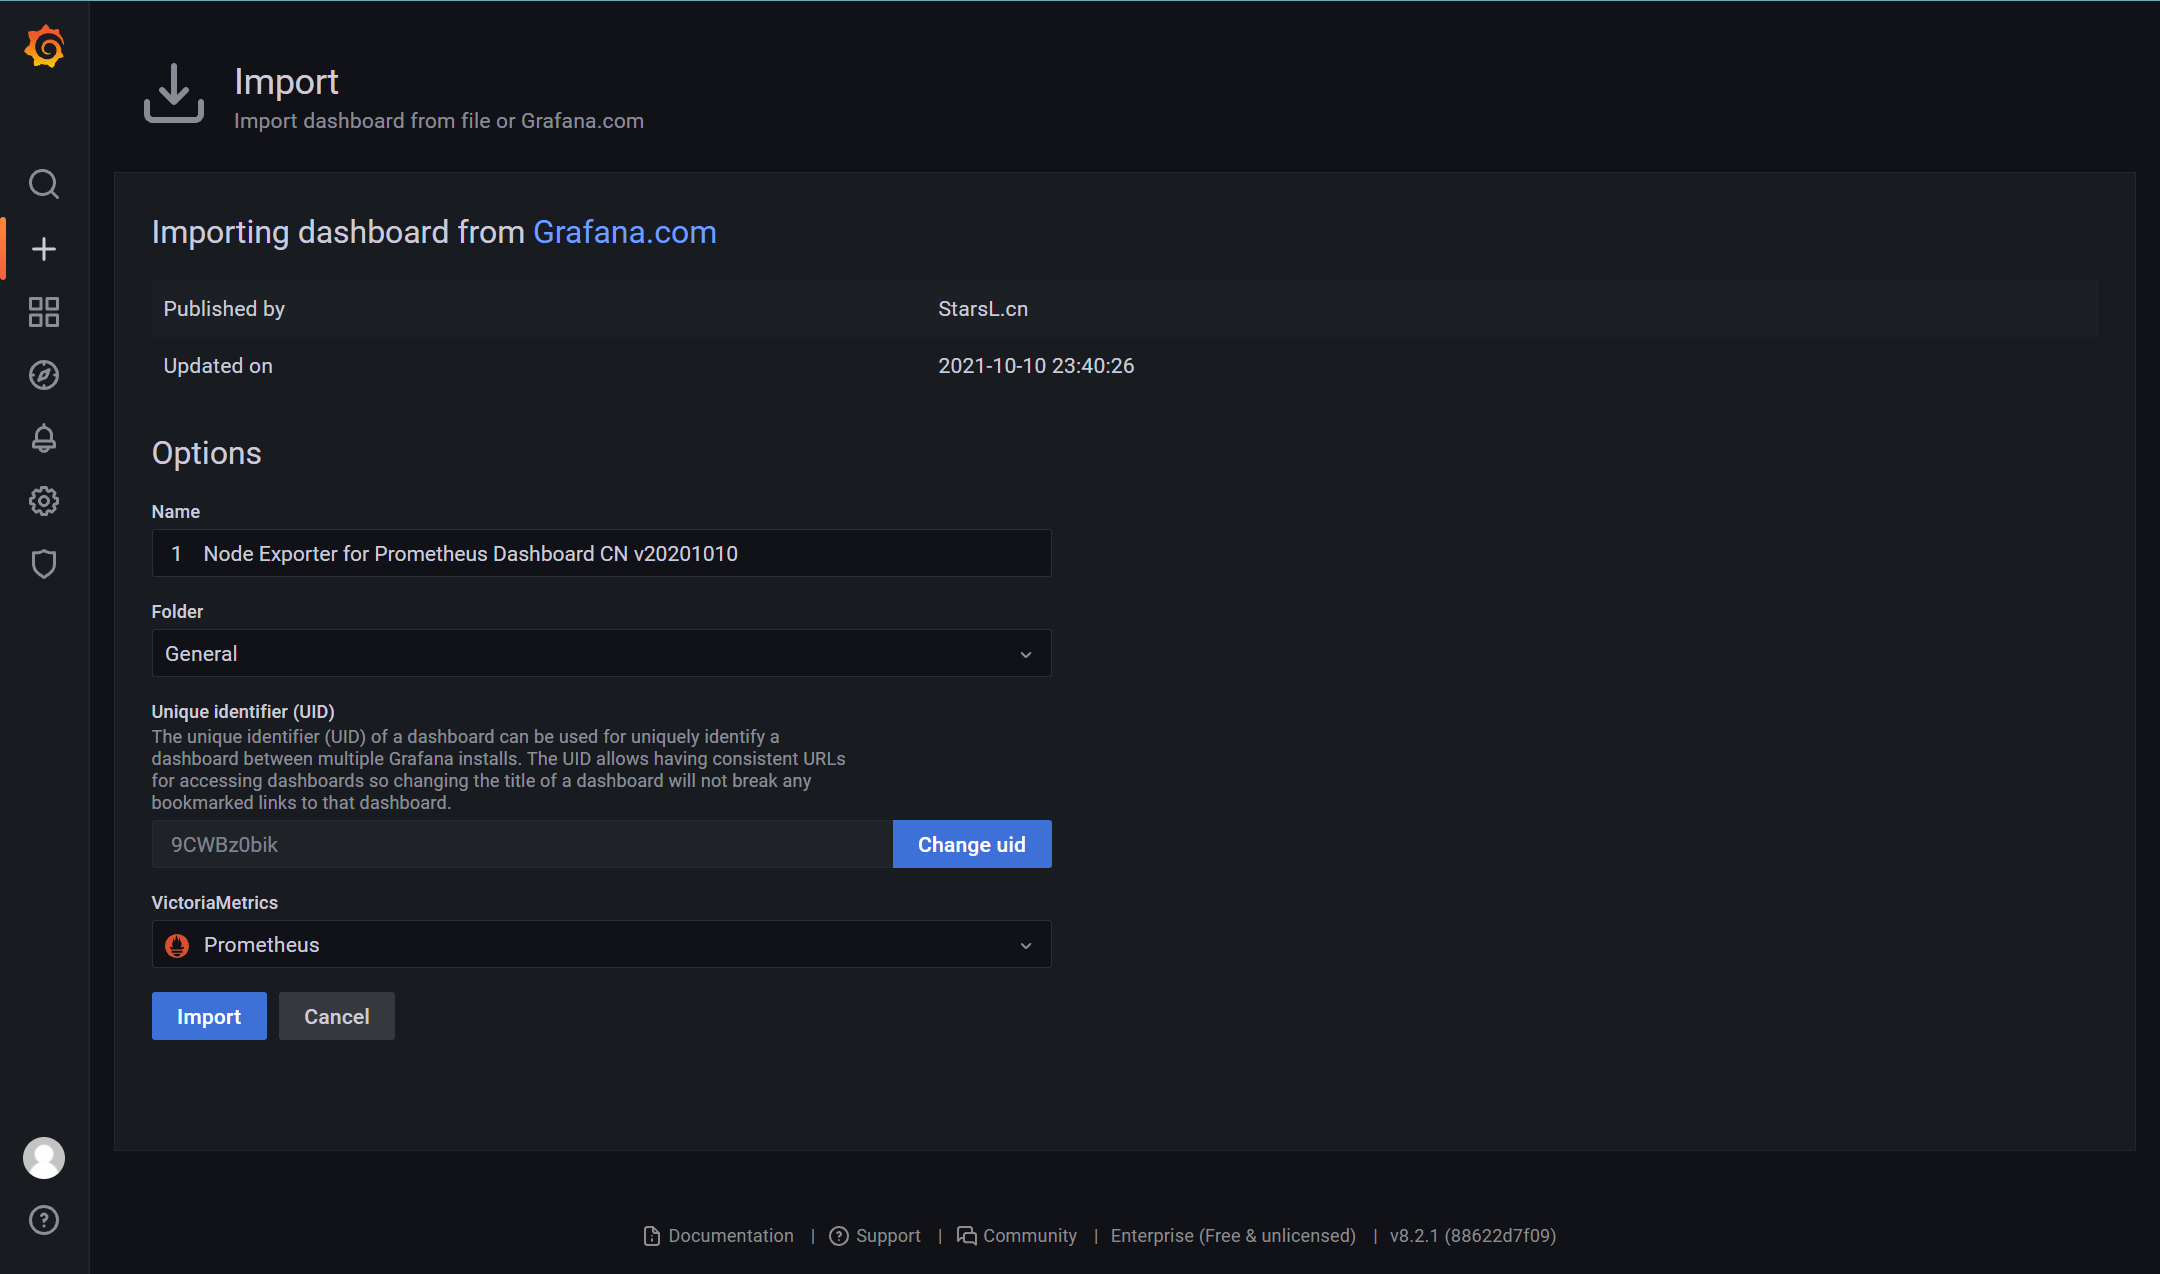
导入dashboard
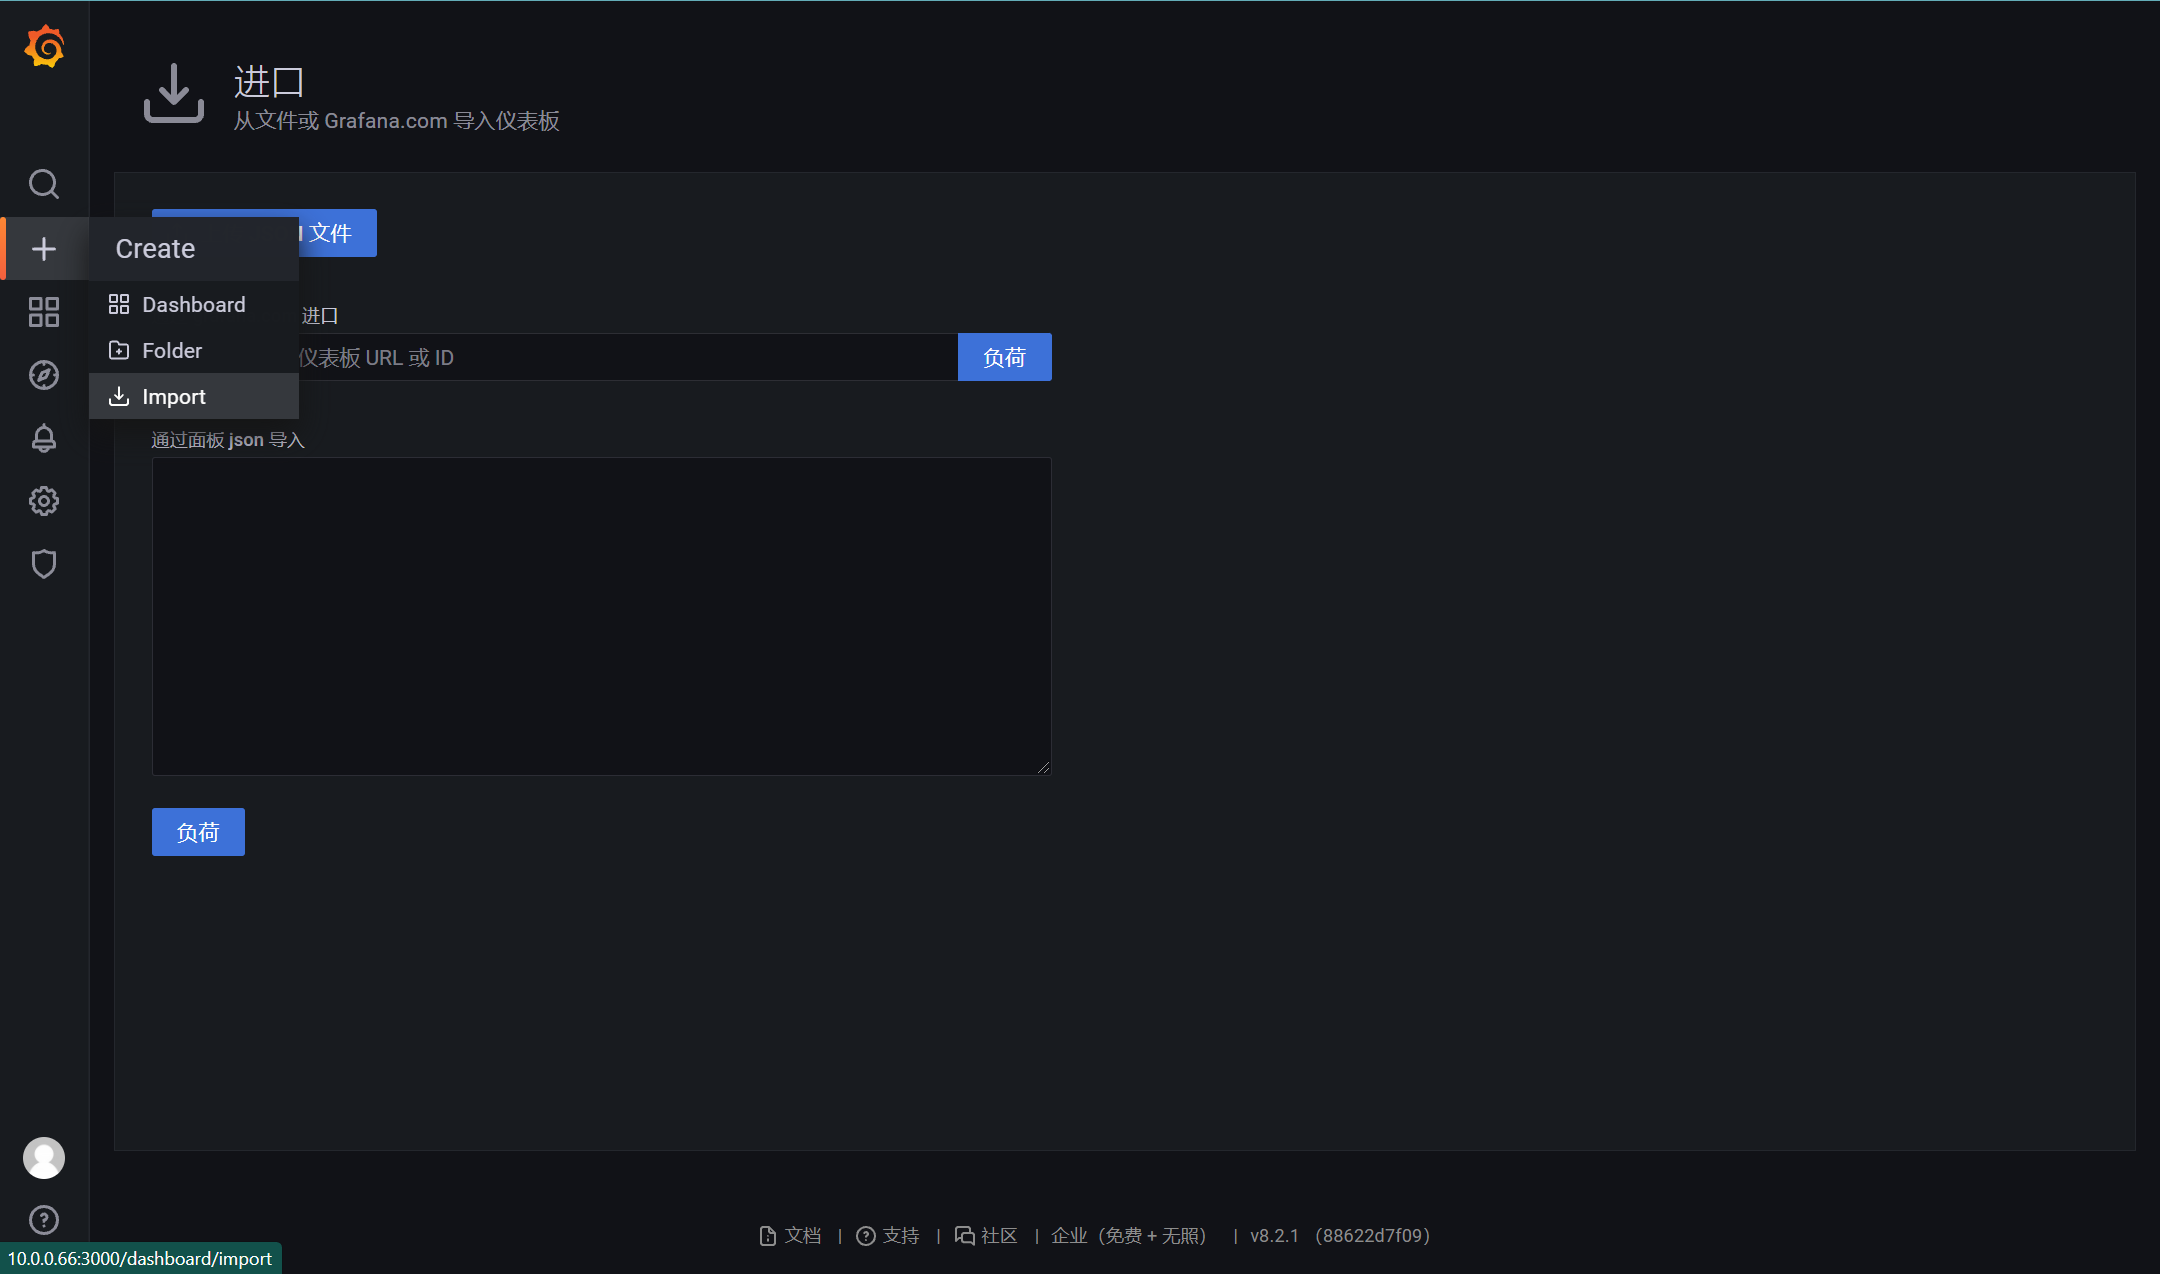
填入面板ID8919确认后&填入应用源确定
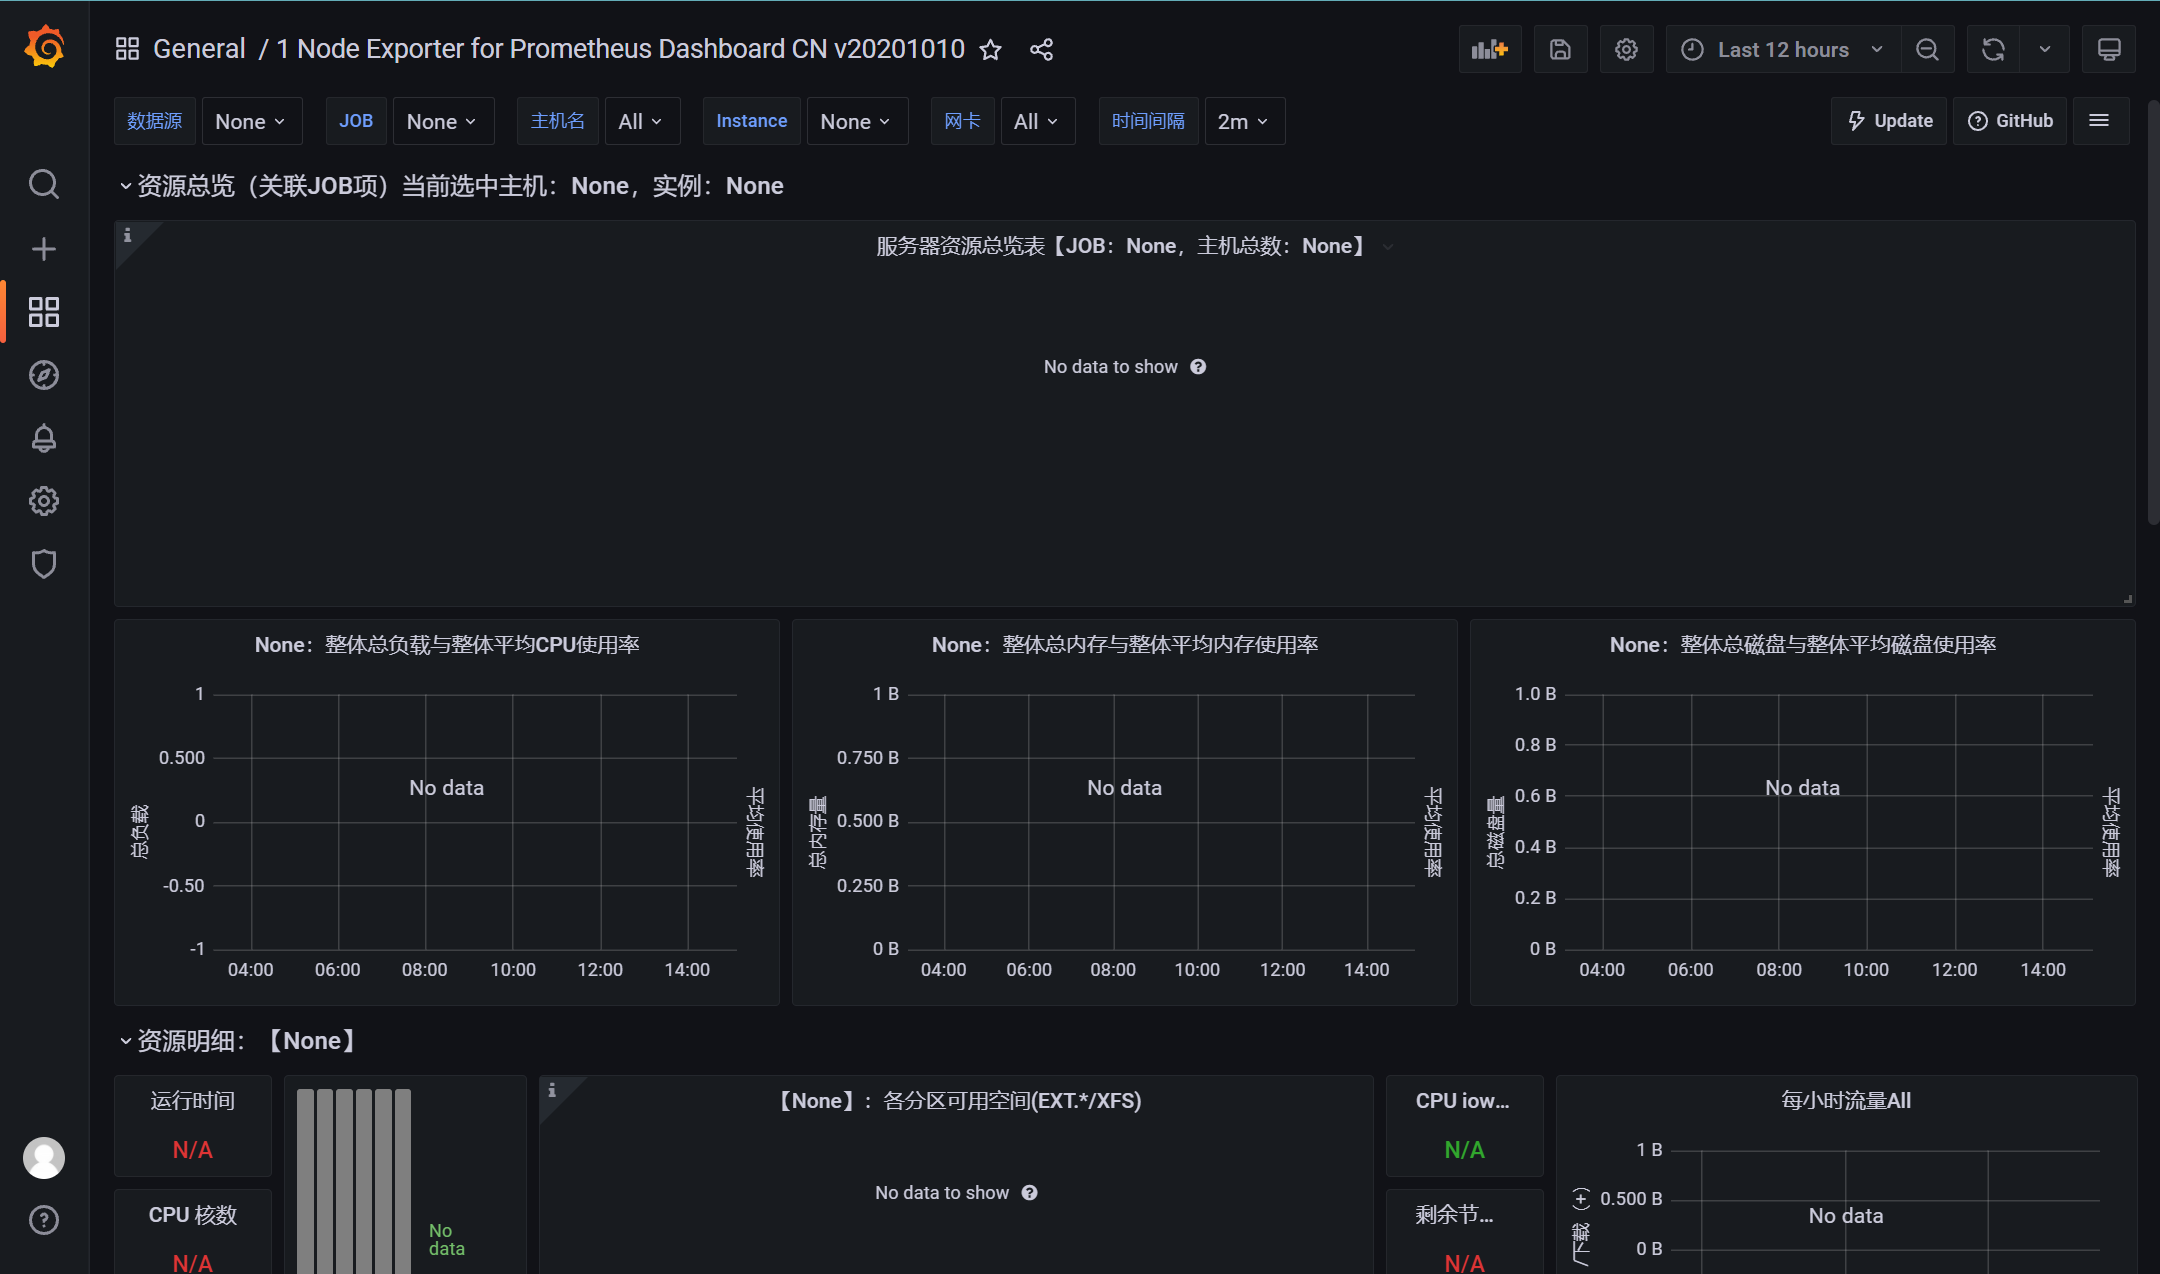
从https://grafana.com/dashboards获取
完成

评论
隐私政策
你无需删除空行,直接评论以获取最佳展示效果